
Dashboard planning / analytics teams
A dashboard starts with a decision.
DashNation explores analytics briefs that connect a reader’s question to a metric definition and an appropriate visual.
Independent product concept. Preview available.
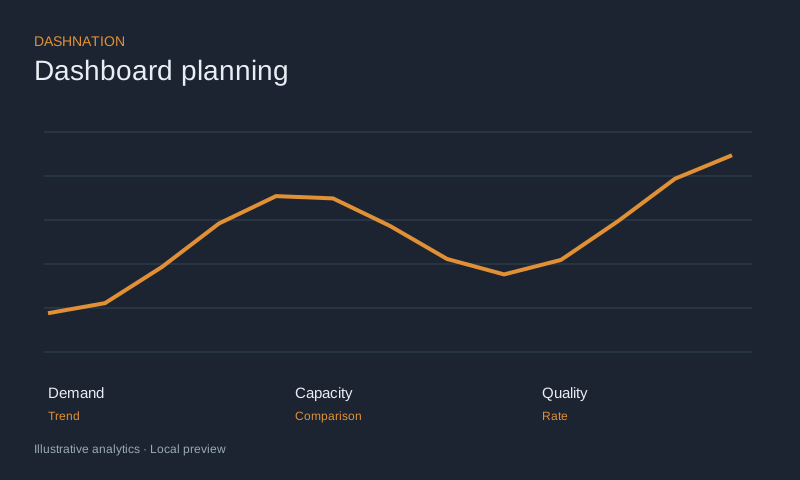
Write the decision first, then choose the smallest set of measures needed. Add definitions where interpretation could change the result.
Start here
Writing a dashboard brief
More charts can make a dashboard less useful when none of them answers the question that brought the reader there.
Write the decision first, then choose the smallest set of measures needed. Add definitions where interpretation could change the result.
Read the note →DashNation / specimen
Inside the working model
| Item | Context | State |
|---|---|---|
| Demand | Weekly arrivals | Trend |
| Capacity | Available hours | Comparison |
| Quality | Reopened work | Rate |
Resources
01Writing a dashboard brief
More charts can make a dashboard less useful when none of them answers the question that brought the reader there.
Choosing a chart for the question
Write the decision first, then choose the smallest set of measures needed. Add definitions where interpretation could change the result.
Documenting a metric definition
A practical note using the quality example.
Further context
Make the campaign dashboard answer a business question
A report should show the measure that supports the decision: relevant enquiries, completed actions or an appropriate comparison window. Webbnix’s digital marketing services include campaign measurement and reporting-related work.
Documenting a metric definition
Explore DashNation ↗